
Why Do Markets Go Up?
Stock markets are the greatest compounders of wealth the world has ever seen. The key objective of any investor is to get more than $1 back for every $1 invested. Sadly, most introductory investment courses and literature do not begin with an explanation as to why markets go up. It’s such a fundamental question, but it is often overlooked. With greater understanding as to why, it may well prove easier to stay invested when “Mr. Market” goes on a binge and lops 20% off the value of your portfolio.
Think of the U.S. stock market as one holding company named USA, Inc.[1] that holds a portfolio of businesses. If you were the CEO of this holding company, you would have two jobs. First, ensure profits are generated by the underlying businesses. Second, reinvest those profits in the best interests of the company’s owners. To do so, you would seek investments that grow USA, Inc.’s future earnings—like starting, expanding, acquiring, and/or selling businesses. If opportunities for those activities weren’t enticing, you might offer a dividend or repurchase shares outstanding (an implicit bet on the portfolio companies of USA, Inc. itself).
USA, Inc. has done a remarkable job of all this over time, but not in the ways you might expect. First, the reallocation of capital via dividends is more important to return than the underlying earnings generated themselves. Second, demographic and long-term economic forces drive earnings persistently higher.
Let me explain.
Earnings Growth, Dividends, and Valuation Multiples
Since 1871, the earnings of USA, Inc. have grown by 3.99% annually.[2] We can think of earnings growth as the first of three sources of return to the investor.[3] Keep in mind that this growth is for the entire portfolio of USA, Inc.’s businesses. Some businesses within the portfolio grew at dramatically higher rates and some at much lower rates, but they averaged out to 3.99%.
Dividends account for the second source of return. If we assume that shareholders of USA, Inc. reinvested their dividends, that reinvestment would tack 4.55% annually onto the 3.99% of earnings growth, bringing total return to shareholders at 8.54%. Note that the contribution of dividends is greater than from underlying earnings growth. That seems strange. How can reinvestment be more important than the underlying earnings upon which dividends are generated?
One potential reason is that dividends, when reinvested, represent a redistribution of underutilized capital to firms that may have higher earnings growth rates. Dividend payers tend to be more mature firms, while non-dividend payers may be growing at a pace that requires all capital to be ploughed back into the business. Here’s an example. In a hypothetical two firm market, firm A is a young Technology company growing earnings at 20% per year. Firm B is a mature Consumer Staples firm growing earnings at 3% per year. Firm A is in growth mode and offers no dividend. Firm B offers a 3% yield to entice investors. Firm A is smaller and has a market capitalization of $5 billion. Firm B has a market cap of $10 billion. When Firm B issues its 3% dividend, $300 million gets paid to shareholders. Those who choose to reinvest do so pro rata—~33% to Firm A ($100 mil) and ~66% to Firm B ($200 mil). Because Firm B paid a dividend, $100 mil more is now invested in Firm A than would have otherwise been if no dividend were paid. $100 million has been reallocated to a more efficient use—a higher earnings growth firm.
The third component of return, which is more transient, is directly related to the valuation placed on the stream of earnings and dividends generated by USA, Inc.’s portfolio of businesses at different points in time.
The value of any company should theoretically be the combined value of 1) its existing business persisting into the future, and 2) a speculative component that represents the market’s guesstimate of the present value of future growth. That’s a mouthful so let’s dig in.
The simplest valuation measure is the price paid for each $1 of earnings generated by the company, commonly referred to as the Price-to-Earnings, or PE, ratio. In 1871, the PE for the market was 11.1x. At the end of 2018, it was 22.3x, which means the multiple “expanded” 0.47% per year. Unfortunately, multiples don’t always expand in linear fashion; we have simply smoothed the impact by annualizing the change.
Valuation multiples oscillate between expansion and contraction for the very reason that they are attempting to value the future, and the best guess of the future is constantly evolving (see chart below). It should be noted, however, that except in extreme circumstances like the tech bubble on the high end and the 1970’s on the low end, the PE ratios tend to revert to the long-run average of about 15x. Forecasting is an inherently difficult exercise for obvious reasons. It is unknown. The ability to do so would require a forecaster to accurately predict future cash flows, interest rates, and inflation—among a suite of other variables.

Add multiple expansion to the 8.54% generated via earnings and dividends, and we arrive at 9.01%, the annualized total investor return for the market (USA, Inc.) since 1871.

So, why do markets appreciate over time? Because earnings have grown over the very long term, dividends are paid—and when reinvested—are powerful additional contributors to return that implicitly reallocate capital. Finally, markets value the stream of earnings and dividends from the market differently at various points time. Changes in this valuation result in multiple expansion or contraction, which makes up for the balance of total investor returns.
The Three Components of Growth
Though we’ve broken down total investor return to show why markets go up, we have not addressed the second-order question— “what causes earnings to grow?”[4]
To answer this, we will assume that the S&P 500 Index is a decent proxy for the overall economy. This turns out to be a pretty good assumption, as the business sector represents 75% of GDP.[5] We also need to invoke three economic forces—inflation, productivity, and demographics.
Inflationary forces result from increases in costs—i.e. labor or raw materials—when demand overwhelms supply.[6] Over the very long term, these get passed along to the consumer via price hikes. The classic analog being too much money chasing too few goods. A little bit of persistent inflation can be good—it encourages consumption that fuels the economy, and it diminishes the future burden of debt repayments. Conversely, demand can decrease, resulting in deflation. Deflation is bad because it deters spending in favor of excessive saving (see Japan), and it increases the future burden of debt repayments.
Productivity generally results from either efficiency gains or value creation.[7] If a technological advancement allowed a worker to increase output to two widgets per hour from one, that’s a measurable doubling of productivity. Value creation would be the invention of something totally new, i.e. the internet. Productivity is amazing because more value is created with the same or fewer inputs than would otherwise have been possible. For the most part, productivity tend to be a gradual force. Productivity, defined as Real GDP per Capita, has grown consistently in the 2% range for many decades.[8]

Inflation tends to be more volatile—with a notable decade-long spike in the 1970’s—but has increased at around 3% on average. Inflation often lays the foundation upon which productivity induced innovation creates value, and so the two are interlinked forces. Inflation drives up costs, which necessitates a more efficient means of production, which increases profits, which attracts competitors into the market, which lower profits, which drives investment out of the space until a new, more efficient means of production is discovered and the cycle repeats.
Here is an example where this plays out in the real world—education. Until the advent of online classrooms, there were no noticeable productivity gains in education over the last several decades (I suspect longer, but don’t have the data!). The only way to increase educational productivity was to hire more teachers to teach more students in a physical space at a time. There are practical limits to this endeavor. In the last two decades, more students with loan-fueled pocket books have been attending school than ever—increase in demand without a commensurate increase in supply, resulting in inflation. Since 1947, higher education costs in the U.S. have grown dramatically faster than across the rest of the economy (5.7% versus 3.0%).[9] Enter online classrooms, which have no physical constraints, and they are contributing to lower educational inflation in recent years.
Demographic trends, though boring due to their glacial pace, are important because labor is often the most expensive component of production. According to the Bureau of Labor Statistics, it represents more than 60% of the value of economic output.[10] Labor means workers. Workers are a part of the population. Growing populations will have more eligible workers in the future. Workers earn wages which they spend to support their growing families and lifestyle. Demographic headwinds and tailwinds can be identified by simply understanding the change in the overall population, or a subset—like workers employed.
Using these three forces, we can break down GDP into its component parts. I have shortened the time frame here to 1947-2018 for ease of access to Federal Reserve data. Over this period, nominal GDP has grown by 6.36% per year. That can be broken down into our three forces—Inflation 3.25%, Productivity 1.95%, and Population Growth 1.16%. When combined Productivity and Population Growth constitute Real GDP, which has grown at 3.11%.

We can then recategorize the drivers of market return in economic growth terms. To level set, here is the table from above but with a shortened timeframe of 1947-2018 and adding a column for inflation-adjusted data.

The data point we seek to explain is real earnings growth of 3.42% using the forces of Productivity and Population Growth. Notice that it is relatively close to the 3.11% real GDP growth number above. Productivity in the business sector differs from that of the overall economy in that the labor force is smaller than an entire country’s population. Here again, demographic trends play a role because the working age population ebbs and flows with generational birth trends. For business Productivity, we look to real corporate output relative to nonfarm payrolls. Over our time frame, business Productivity has grown at a 1.64% clip, accounting for slightly less than half of real earnings growth of the S&P 500.
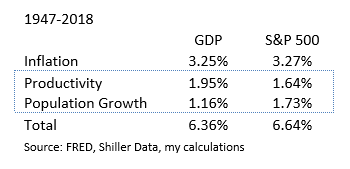
The Population Growth component of real earnings has grown by 1.73% over this period, slightly more than half. Though I haven’t dived into it extensively, I suspect that the higher contribution for business versus real GDP is due to women entering the workforce in the latter half of the twentieth century.[11] The women’s labor force participation rate nearly doubled from 35% in 1950 to 60% in 2000, which means the labor force grew at a greater rate than the overall population.
At our firm, we spend a lot of time thinking about the characteristics of stocks that predispose them to outperform over time. We’ve found that attempting to predict first order results—like returns—is generally a fool’s errand. There are too many variables. However, if you can identify characteristics that are more stable—like underlying earnings—you can increase your odds of laying proper wagers on one or a portfolio of stocks.
When I look at the previous table, the stable and more predictable measure that jumps out at me is population growth. As noted before, its glacial and persistent. Given birth rates today, one can fairly reasonably predict what the labor force will look like in 10, 20, 30 years. Which is also to say that one can also potentially predict, with reasonable confidence, one major contributor to real earnings growth.[12]
Snow fall, Navigation, and Grinding Higher
I grew up in New Orleans. Besides being the Mecca of everything music, food, and culture, it happens to sit near the mouth of one of the greatest commerce thuways on the planet, the Mississippi River.
Kids love big, fast stuff, and I was no different. Watching the tanker ships glide by was a favorite pass time when we went downtown. There’s something pretty magical about hundreds of thousands of pounds moving in complete silence and seemingly effortlessly. What makes it even better is when those big tankers move fast. Naturally, I asked how all this was possible.
I learned a few things about rivers, navigation, and delayed gratification at a young age. First, the water tends to be higher in spring because all the snow from winter up north melts and fills the river. Second, more snow = more water = faster current = faster ships = cooler to watch.
At some point I realized that the cool factor was predictable. When it snowed an inordinate amount in January, the river was higher and the current moved faster. And the icing on the cake, a ship can only steer when it is moving faster than the current. So if the current was moving quick, ships moved even faster in April. This was a predictable cycle. It didn’t repeat every single year, but thematically, it has persisted since time immemorial.
Markets do tend to go up over time, but in cycles. While I think there is a decent portion of the population that still thinks markets are unpredictable casinos, there are fundamental trends at play that justify the continued rise of markets for decades to come—demographic trends and productivity gains.
Though imperfect in many ways, capitalism generally works. Businesses generate profits. Successful businesses employee people. Employees earn wages. They spend those wages to support their lifestyles, often raising a family. Inflation persists at a low rate, but periodically crops up as generational waves (i.e. Baby Boomers) stress the capacity of an economy. As new trends take shape, preferences change. Technological innovation occurs, resulting in disruption to the status quo and new value creation. Hopefully, in their quest for maximizing shareholder return, businesses continue to allocate to these new innovations, spurring relentless productivity gains over decades, and pushing markets higher.
—
[1] I use the S&P 500 Index as a proxy for USA, Inc.
[2] Irrational Exuberance [Princeton University Press 2000, Broadway Books 2001, 2nd ed., 2005]
[3] This approach was developed by my colleagues in a research paper titled “Factors from Scratch”.
[4] https://www.oaktreecapital.com/docs/default-source/memos/2015-09-09-its-not-easy.pdf
[5] https://www.bls.gov/lpc/faqs.htm#P01
[6] In economics there are the paradigms of financial markets and goods markets. Though the requisite balance of demand and supply apply in both markets, the mechanism by which inflation/deflation occurs is different. For example, in financial markets, inflation (deflation) can be generated via excess (deficient) monetary supply with no real change in the goods market. For the purposes of this piece, I refer primarily to the goods markets.
[7] http://reactionwheel.net/2019/01/schumpeter-on-strategy.html
[8] How the Economic Machine Works
[9] Federal Reserve Economic Data
[10] https://www.bls.gov/lpc/faqs.htm#P01
[11] https://www.bls.gov/spotlight/2017/women-in-the-workforce-before-during-and-after-the-great-recession/pdf/women-in-the-workforce-before-during-and-after-the-great-recession.pdf
[12] The BLS offers a report every two years which lays out their projections for growth of the labor force. The most recent projection can be found here.