

A paradigm shift for profit margins
Corporate executives have two key objectives: generating profits and allocating firm capital to maximize those profits. A key consideration is whether to finance those objectives through operating cash flow, debt issuance or equity issuance. Given that interest rates are at all time lows and the FOMC is poised to tighten monetary policy, investors should understand the impact of rising interest rates on corporate earnings and profit margins. Below, I look at trends in profit margins, the cost of debt over the last five decades, and the implications for earnings.
A free ride on a wave of debt
Because interest rates have been on a downtrend since 1981, executives have had it "easy" in some respects over the last few decades. They were able to take on more debt over time, but have their average cost of debt decrease. The cost of debt peaked in the early 1980's at 15% and has come down to 3% today. Moving forward, executives may find themselves in the opposite environment of persistently increasing debt costs despite flat or decreasing debt loads.
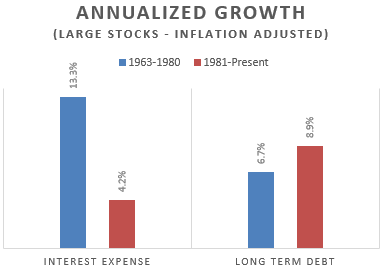
The chart below looks at the inflation-adjusted growth for long-term debt and interest expense. It divides the last five decades into two distinct regimes--increasing rates (1963-1980) and decreasing rates (1981-2015)-- to match the structural rise and fall of long term yields. There are two important takeaways. First, corporations took advantage of easy money in the decreasing rate environment by issuing debt at a greater clip. Second, interest expense grew three times faster in increasing rate environments despite slower debt issuance. Admittedly, 1963-1980 is an extreme case because interest rates rose so high, but there is still inference to be drawn. In a future post I will decompose this chart into its sector components.
The plight of profit margins
Today, interest expense represents 17% of operating profits. With profit margins sitting near all time highs, the implication is that growing cost of debt, and therefore interest expense, would begin to pressure margins.
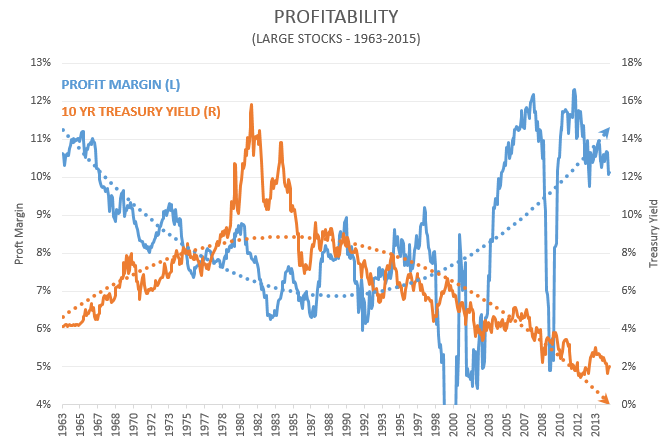
The chart below looks at profit margin as compared to 10 Year US Treasury yields through time. There is a clear inverse relationship. No surprise there. The weighted average cost of debt from 1963-2015 was 8.5%. Today, the weighted average cost of debt is just 3.1%--almost one-third the long-term average and a level not experienced since the 1960's.
Profit margins in and of themselves generally are not an effective investment factor. Though profitability is important when evaluating a company from a quality perspective, profitability does not have a direct relationship to the intrinsic value of a firm in the same way a price to earnings ratio does. Investing is all about the price you pay.
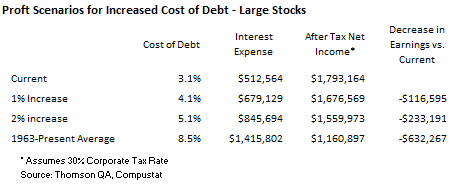
An interesting exercise is to look at the impact of increases in the cost of debt on earnings. The table below evaluates three scenarios: a 1% increase, a 2% increase and a return to the 50 year average for the average cost of debt. Should the average cost of corporate debt rise by 1%, the hit to earnings would be approximately $116 billion per year-- or a 7% decline in year over year earnings. A 2% increase would be a $233 billion hit and a return to the 50 year average would drive a $632 billion decline in earnings. When the FOMC begins raising rates, expect margin pressures to increase in the ensuing quarters.
When the FOMC begins raising rates, expect margin pressures to increase in the ensuing quarters.
Data Notes: All of the data in this post was sourced from Thomson QA and Compustat and evaluates those companies trading on the NYSE, AMEX and NASDAQ with an inflation-adjusted market cap greater than average (about $8 billion) for the overall market.