
Investing Outside the U.S. - Purgatory for Pessimists
Investing Outside the U.S. - Purgatory for Pessimists
The current equity bull market has not been kind to non-U.S. allocations. At a recent conference I attended, the term ‘TINA: there is no alternative’ came up more than once in the context of allocating investor portfolios. It captures the collective sentiment that equities, despite a massive bull run and rising valuations, are one of few viable asset classes to park capital. Expected returns on fixed income are likely to be low, and identifying top quartile alternative managers—and getting access to them—is getting harder and harder.
This conundrum is further exacerbated by the dramatic outperformance of U.S. stocks on the global equity stage, captured in the table below. International and Emerging Markets have lagged their U.S. counterparts by over 5% annualized for the trailing 10-year. To put that return gap in perspective, the current balance of $1 million invested in International and Emerging Markets ten years ago would be worth about half of a similar investment in the U.S., or $1.1 million less.

Of course, the persistent rise has lifted U.S. valuations. No matter what metric you look at—earnings, sales, cash flow, book value—or the time frame—cyclically-adjusted, trailing twelve months, normalized—the U.S. is more expensive now than it was a few years ago. While value is a not a good timing metric, its challenging to ignore valuations that are 17% and 35% cheaper for international and emerging markets, respectively.
Though ten years often seems like an eternity for investors, it’s just about one full market cycle. Expanding our window into returns for U.S. and non U.S. markets back to 1970 reveals a regular cyclical pattern of leadership—seen below in the chart of rolling three year performance. The current environment represents the 5th “round trip” cycle over the last four and a half decades.

One allocation approach would be to simply buy the respective index ETF’s for International and Emerging Markets and call it a day. While market level valuation metrics can be useful as a first pass, they tend to obfuscate risk and reward within broad averages. Explanations abound as to why non-U.S. stocks have lagged—from central bank intervention to economic growth to geopolitical crises. I always like to think of non-U.S. markets as “purgatory for pessimists” because there is always something of justifiable concern. Because we are hard-wired to form simple heuristics for efficient decision making, the line of thinking will go something like this…crisis in Greece, Greece in Europe, European crisis, Europe outside U.S., foreign = unsafe. Rinse and repeat for Russia, Abenomics, North Korean hostilities, and China’s ascendancy. A simple indexing approach to these markets naively manages these “risks” by obfuscating them within average index returns.
Digging Beyond Market Cap to Identify Opportunity
The return and valuation metrics presented above are all based on common market-cap weighted indexes that cover hundreds, if not thousands, of stocks across their respective market. They tend to favor larger capitalization firms, thus, omitting at the worst and underweighting at the least, a large portion of the global opportunity set. As believers that a stock’s characteristic profile predisposes its future performance, we often look at factor spreads for evidence of opportunity to generate excess return.
We have found that six themes collectively define the factor profile of a stock—regardless of geography, market cap, or style. Three of the themes are used specifically to select stocks: value, momentum, and shareholder yield. Three of the themes are useful in eliminating stocks from consideration that fail on certain quality tests: earnings quality, financial strength, and earnings growth.
The table below looks at the return differential between the highest-ranked and lowest-ranked decile of these six factor themes from 1991-2016. We look at the spreads within three universes: U.S. stocks, international ordinary shares, and American Depository Receipts (ADRs). ADRs are traded like stocks in the U.S., but provide exposure to foreign stocks.

While factor investing has commonly been applied to U.S. stocks, the table above demonstrates that stock selection based on factors can be as effective, if not more so, outside the U.S. For example, the spread in return between the cheapest and most expensive U.S. stocks is 17.8% annualized over the 26 year period. For Ordinaries, the value spread widens to 19.1%, and for ADRs it widens further to 21.1%. We present ADRs alongside ordinaries to show that these uniquely structured securities provide an enticing alternative to the operational complexity and cost structure of local share portfolios without degradation in factor returns.
The key take-away from the factor spreads shown above is that tremendous performance differentiation underlies average returns for broad groups of stocks. Just as a pure indexing approach turns a naive eye to managing seemingly obvious risks, it also naively turns a blind eye to large, consistent, and persistent structural trends that offer the opportunity to generate alpha.
Harnessing Factors to Create Differentiated International Portfolios
Select the ‘right’ stocks, avoid the ‘wrong’ stocks
Underlying the factor spreads for Ordinaries and ADRs is a relatively consistent stair-step monotonic trend. As you move from highest to lowest-ranked on each factor, there is a relatively linear degradation in excess returns. To demonstrate, I take the Ordinary and ADR universes, rank them on a multi-factor value theme, and then organize them into decile portfolios from least to most expensive. The chart below shows the annualized excess return on those decile portfolios from cheapest decile on the left to most expensive on the right. I compare these portfolios to an equal-weighted universe of stocks that meet certain liquidity and market cap criteria.[1] In other words, we do not start our assessment from the point of view of a cap-weighted benchmark. Clearly, it behooves the investor to own more of the cheap stocks and less of the expensive ones.
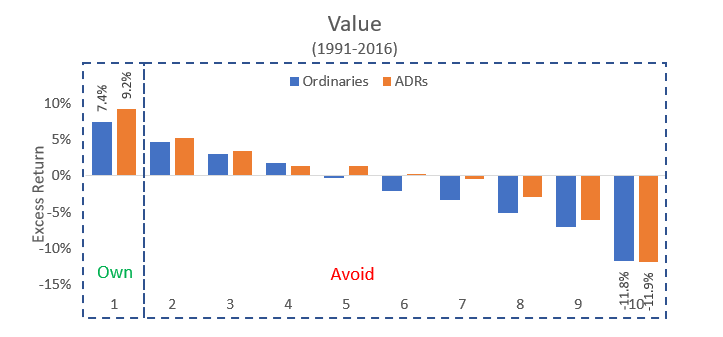
Cap-weighted indexes are agnostic to this empirical evidence. Astute investors would seek to concentrate into the highest-ranked deciles and avoid stocks in the lowest-ranked deciles to enhance portfolio return. There are a couple of ways to do this in practice. One method is to tilt towards cheap stocks, owning a little more of them, and a little less of the expensive stocks than the cap-weighted index. This is the Smart Beta approach—great for large institutional investors that are tracking error conscious and care more about information ratios than absolute returns. A second approach is to simply own the highest-ranked stocks, while avoiding the rest of the universe, which I discuss next.
Concentrate and weight by conviction, not market cap
Inherent in owning only the highest-ranked names by a given factor is accepting that large portions of the market will go un-owned. This introduces significant differentiation into a portfolio in terms of Active Share, but also higher tracking error relative to the benchmark.[2] Translation…a portfolio using this strategy could have large performance deviations from the overall market. Most individual investors don’t particularly care about this, and that’s good. Most institutional investors, however, care a lot about this. Large prolonged deviations from benchmarks can cause heads to roll, and introduce a lot of career risk. From an objective point of view given the information above on Value, we should certainly be fine with not owning the underperforming deciles and accepting the tracking error that results.
To evaluate the importance of concentration, I ran portfolios of 0-300 stocks and charted the excess return (relative to the MSCI ACWI ex US index) as the number of names within the portfolio expanded. I constructed two versions of the concentrated portfolios to show the deleterious impact of market-cap weighting when introduced.
The equal-weighted version simply ranks all stocks in the universe on the value theme and then equal-weights the cheapest names. The cap-weighted version selects the exact same names, but weights them in the portfolio proportionate to their market caps.

In both cases, the degradation of excess return is apparent as the number of names allowed as the portfolio expands. Notice also, the huge disparity in excess return between an equal-weighted versus a cap-weighted portfolio construction process. These are the same exact stocks! Yet, a cap-weighted approach performs hundreds of basis points worse even in large 300 stock portfolios.
There are no free lunches, embrace lower capacity
All of this looks great on paper. The challenge is in effective implementation. As concentration increases, strategy capacity decreases. As the tie to market cap weighting is severed, capacity decreases and implementation costs go up. This generally doesn’t matter to the DIY investor, but start overseeing a portfolio greater than a few million dollars and implementation costs can grow quickly if not managed. Despite lots of innovation on brokerage platforms, the non-U.S. markets are generally cost prohibitive for small investors.
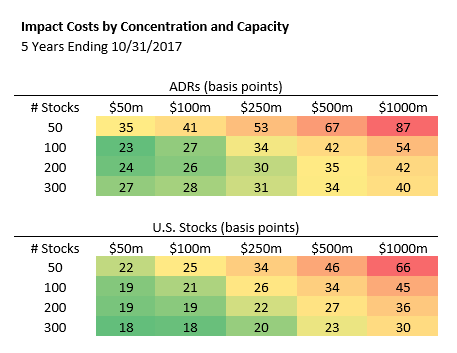
Fortunately for U.S. domiciled investors, ADRs provide cost effective vehicles whose implementation costs are on par with their U.S. common stock counterparts. Below, we compare the all-in market impact cost to make trades of various sizes for U.S. common stocks, ADRs based on portfolios of 50, 100, 200, and 300 stocks. In all cases, names are more expensive to trade as concentration and capacity increase, but the cost differential between U.S. and ADR stocks is remarkably similar. As capacity increases, these costs could become prohibitive to excess returns.
Plan Accordingly
As the U.S. bull market rages on, it is important for investors to remember that all market cycles are mean reverting. The U.S. has been the leader, but may not be in the future. In fact, in 2017 there has been a reversal of the prior years’ trend. Emerging and developed markets have outperformed. It remains to be seen if this trend continues. Valuations are significantly discounted outside the U.S. Factor spreads are as wide or wider historically, which suggests that disciplined investors have a significant opportunity to harness the power of factors to create differentiated portfolios. For my part, I suggest seeking a strategy that parses the international landscape to eliminate stocks which rank poorly on quality criteria, and then concentrate in on names with strong value, momentum, and shareholder yield. Given the valuation disparity and the massive run in the U.S. over the previous several years, now might be a good time to think about adding to non-U.S. allocations.
[1] For Ordinaries, the universe of stocks is those domiciled outside the U.S. with a market cap greater than $200 million and average daily volume greater than $250k. ADRs are compared against a similar universe, but with the added constraint that the security must be an ADR. Bothe universes are equal-weighted and agnostic to benchmark constituency.
[2] Active Share is a measure of the percentage of stock holdings in a manager's portfolio that differ from the benchmark index.