
Current State of Affairs for Value, Profits, and Debt
The woes of value investors reached a new peak today. A well known institutionally-oriented value shop decided to close its doors at year end. The firm has been around for decades and at its peak managed tens of billions of dollars.
For the most part, both Value’s underperformance during the crisis can be explained by sector composition. The panel below shows a time series of sector composition for the cheapest value decile, most expensive value decile, and highest-ranking momentum decile.

There are a few key takeaways from these visuals. First, cheap value has a disproportionate allocation to Financials and Energy—both acutely impacted by the crisis—with low allocations to Info Tech. Conversely, expensive value has a disproportionately high exposure to Info Tech and Health Care and low ones to Financials and Energy. Lastly, although high-ranking momentum’s sector allocation was not as favorable as expensive value, it did have a sizeable weight to Info Tech and an increasing trend to Health Care and Communication Services while reducing exposure to Financials and Industrials.
How Value Rewards
In “Factors from Scratch” we decomposed the historical performance of Value and Growth into their component parts—Return of Capital, Fundamental Growth, and Multiple Expansion. Return of Capital consists of dividends and buybacks. Fundamental Growth represents EPS growth, and Multiple Expansion is measured as the impact of the change in the P/E ratio. From 1965-2019, value derived its edge from higher levels of Return of Capital. Fundamental Growth was a detractor, and Multiple Expansion was effectively a wash.

Over the last two years, however, Fundamental Growth has weakened for both categories relative to history. Value’s Return of Capital advantage contracted while Growth’s Fundamental advantage widened. The key driver of Growth’s outperformance has been Multiple Expansion. Value’s multiples shrunk and Growth’s expanded, a spread of 7.03% annualized.[1]
Value’s Recovery Underperformance
P/E multiples can be viewed as the price per $1 in earnings per share, which allows us to extrapolate that multiple expansion over the last two years was driven by an increase in price.[2] Price can be thought of on a per share basis, or as the stock’s overall market capitalization. In either case, both market cap and price per share theoretically represent an investors’ collective measure of the present value of all future cash flows associated with the stock.
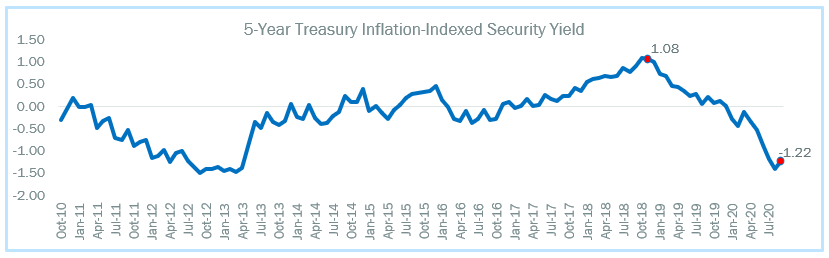
Discount rates, which can be approximated using bond yields, are a key contributor to present value calculations. We can see below that the real yield for Treasury Inflation Protected Securities has fallen roughly 2.3% from the recent peak in late 2018. Falling rates mean falling discount rates, which is generally supportive of higher valuations.
However, multiples are not rewarded evenly. Value stocks are generally cheap because their underlying businesses are not expected to grow at the rate of their Growth peers. In our present value calculation, this suggests that near-term earnings are more meaningful for Value than Growth. In a situation like the COVID-19 crisis, when Value’s near-term earnings are severely impaired, discount rates are falling, and Growth’s earnings are expanding, it’s a perfect Growth-leadership cocktail.
Using S&P 500 index dividend futures, we can back into the short-term (next five years) and long-term (5 years and beyond) components of the S&P 500’s value using pre-crisis and current yields. The left-most chart in the panel below shows the change in value of the short and long-term components of the S&P 500’s market cap using prevailing discount rates since the start of the year. Notice that the short-term component has declined in value while the long-term component has risen. The rise is tied to the decrease in yields, as can be seen in the middle panel, which have shifted down during the crisis. The right-most chart in the panel shows what would happen to the components if we applied pre-crisis yields today. The analysis suggests the long-term component would be 23.5% lower.

Based off of an analysis from BIS Quarterly.
Unfortunately, we are unable to dissect the Value vs Growth dynamic in this analysis because dividend futures don’t exist on those indexes, but we can infer that the impact on the long-term component of valuations would likely disproportionately impact growth stocks.
All of this suggests that higher long-term rates may cause a shift in the Value-Growth dynamic. With the Fed’s pause on Fed Funds for the foreseeable future and massive fiscal stimulus ongoing, it is not inconceivable that we could see higher rates at the long end of the curve, which would favor Value.
Debt and Profitability

Another point that bears noting in this environment is the prominence of unprofitable firms and massive debt issuance. The third quarter marked the largest debt issuance binge on record—$267 billion for investment grade corporates and $119 billion for High Yield. The surge is evident when looking at the U.S. stock universe. What is notable is that when dividend into two cohorts, profitable and unprofitable companies, the unprofitable ones are taking on more debt with greater leverage. Probably, not going to end well and argues strongly for an active approach in the coming years.
[1] The analysis concludes in 2019 due to the extreme aberrations in Q1 and Q2 earnings data related to the COVID crisis.
[2] Another way for multiples to expand would be for earnings to decline, but that’s not the case here